
Monitoring and control
of plants with storage.
The zeroCO2 portal for anyone with a storage plant, from a home to a factory. One plant or many, with the data as it arrives from the field.
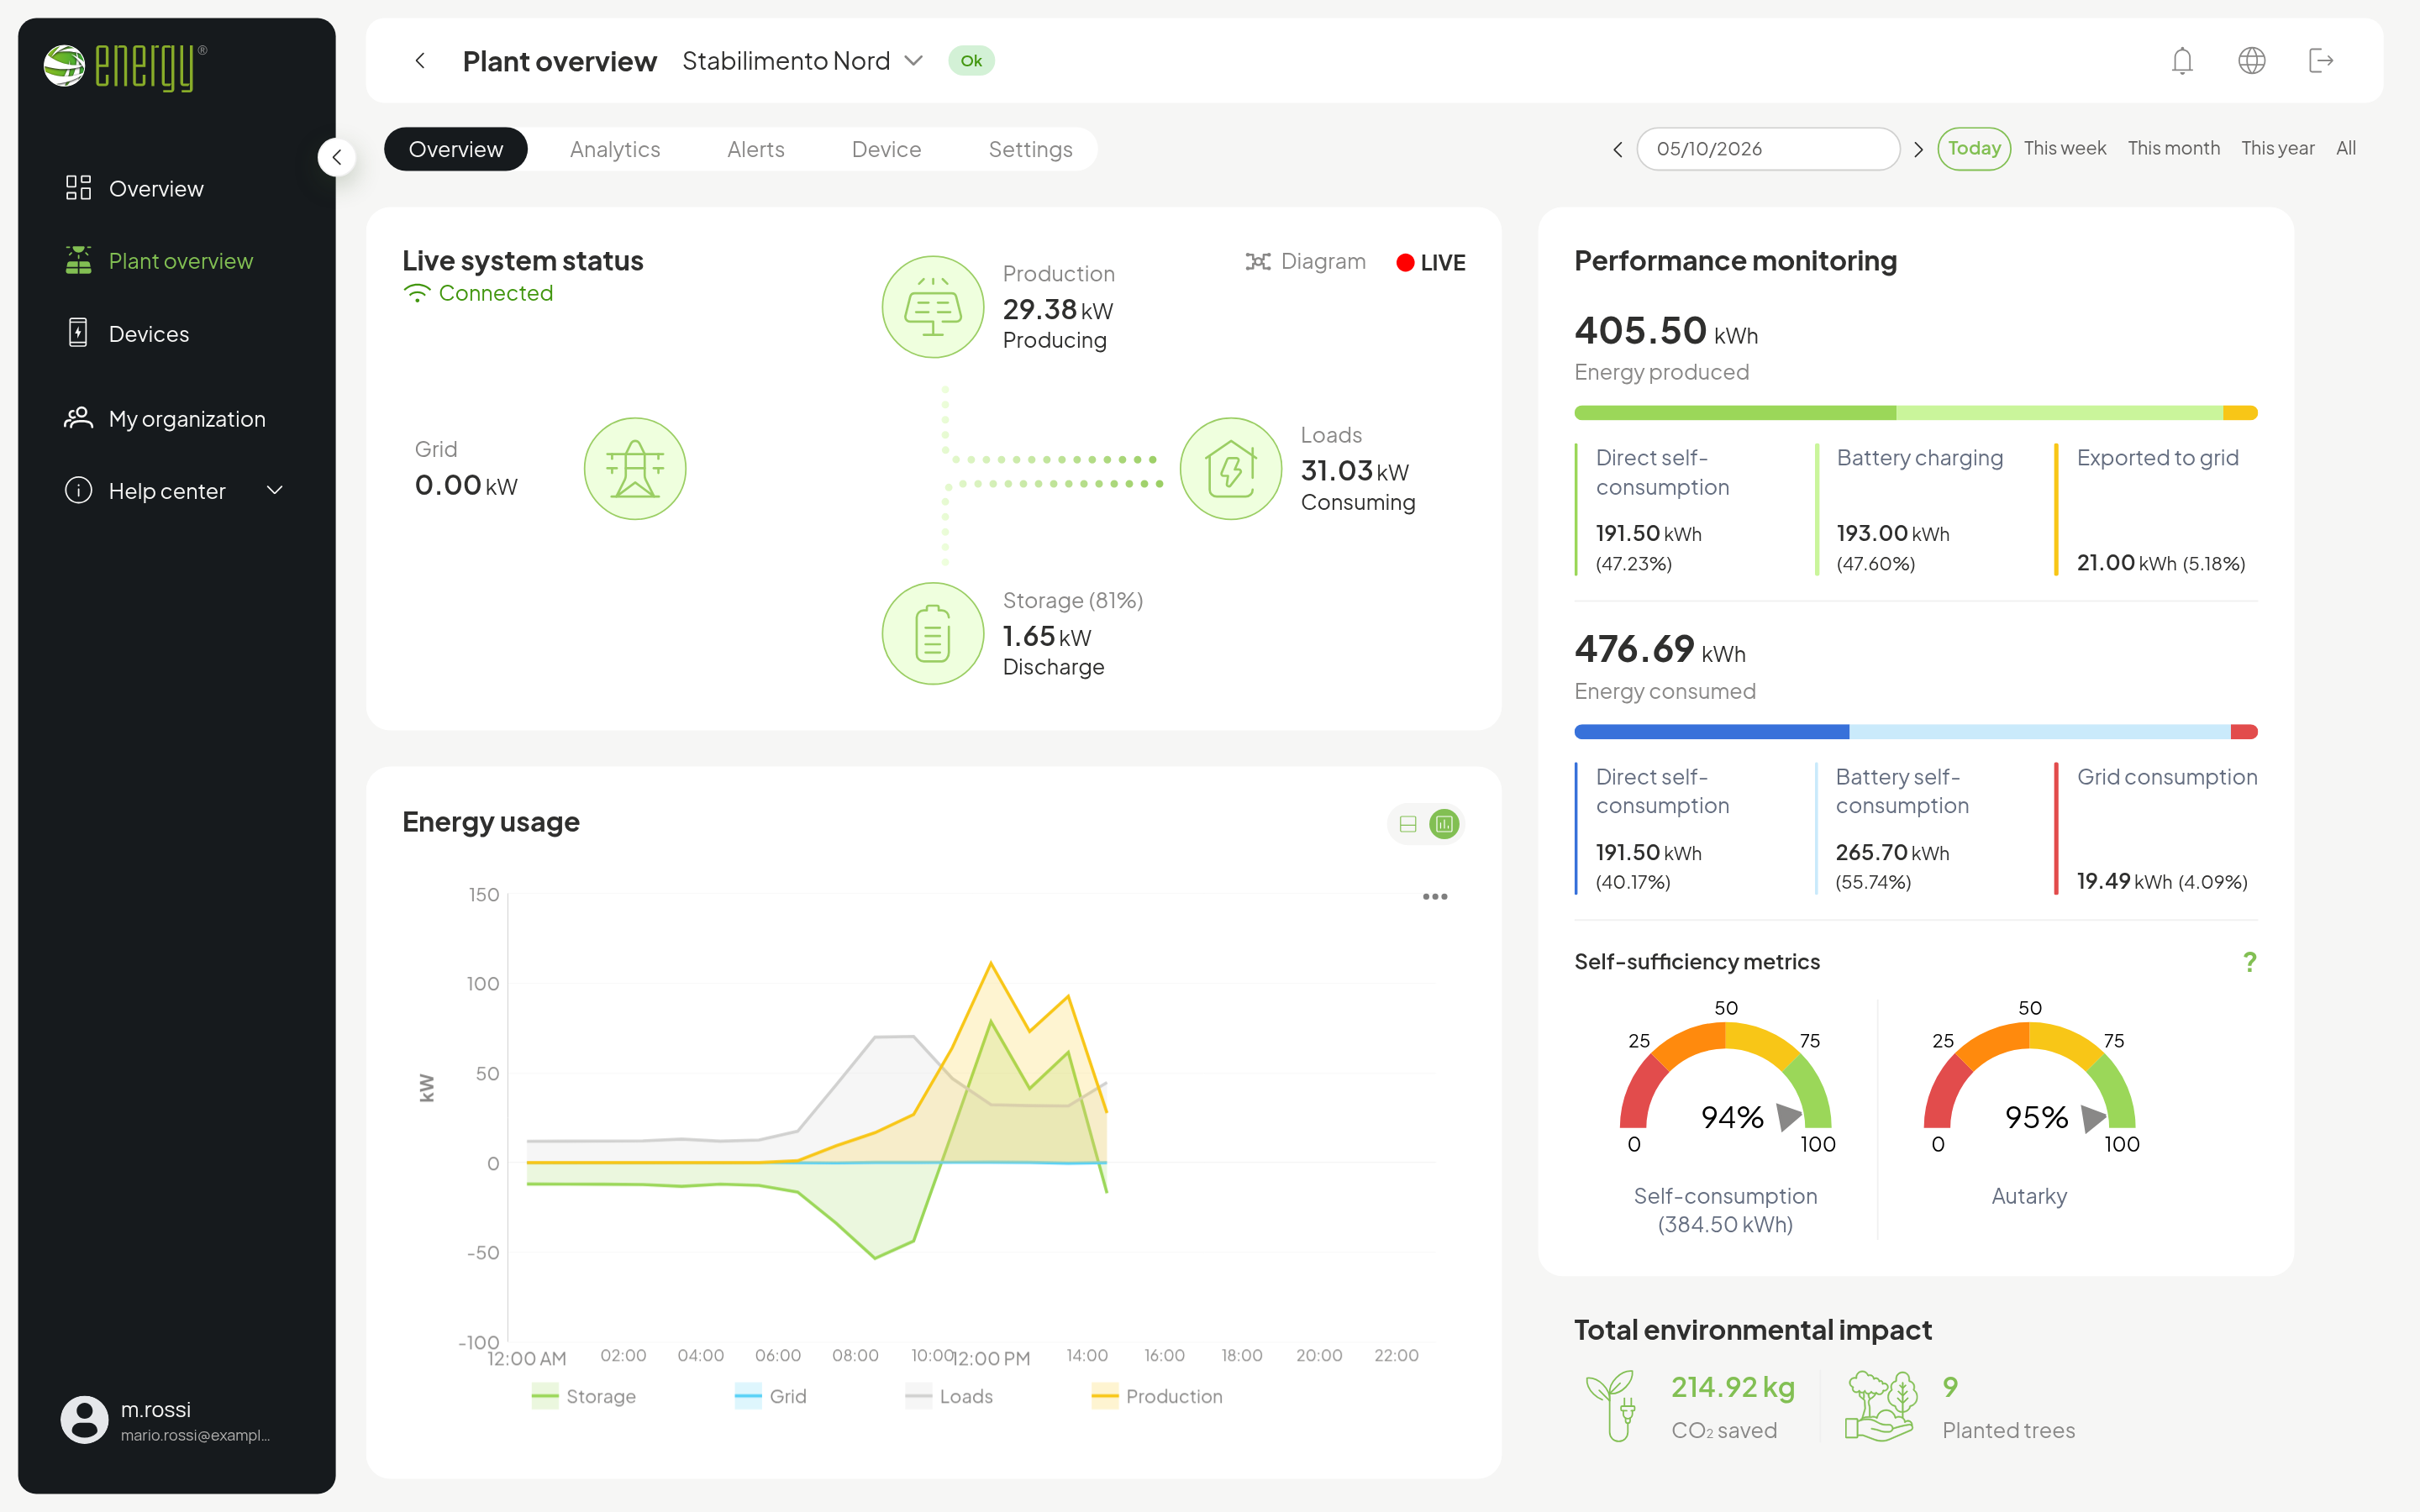
- Everything under control.Production, grid, loads and battery in real time, the status of every component, alarms with their history.
- Clear analysis.Energy balance by day, week, month and year, self-consumption and autarky, exportable charts.
- Your plant answers, with AI.The assistant reads the same data as the portal and answers with your plant's figures, always saying which period they refer to.
A customer's question
Why didn't the battery fully charge yesterday?
Yesterday the plant produced 9.8 kWh, against an average of 17.6 kWh over the last seven days. The battery reached 64% at 14:30 and from 17:00 it powered the house; at 22:00 it was at 40%. No alarms in the period. With less production, a partial charge is normal.
An installer's question, at the end of the job
Check the installation of the Rossi plant.
Result: not passed. Registry and connection are fine: the device is online and sending data regularly. Two checks fail: there is an active alarm and, in the commissioning log, the battery test was not run. The other tests passed.
An installer's question
How are my zeroCO2 XL plants doing?
Of the 24 XL plants you installed, 22 are connected with no open alarms. To look at first: Logistica Sud has sent no data since yesterday at 18:40; Stabilimento Est is connected but has 2 open alarms. This is a snapshot of connection and alarms: for production and yield, ask about the single plant.
A customer's question
How is the battery working? Is there anything to keep an eye on?
Over the last month the battery did 26 cycles, with an average depth of discharge of 74%. Temperatures between 18 and 29 °C, maximum difference between cells 18 mV. Efficiency is 92%, within the norm, and the state of health reported by the battery is 98%. No indicator outside the reference.
The plant diagram, component by component.
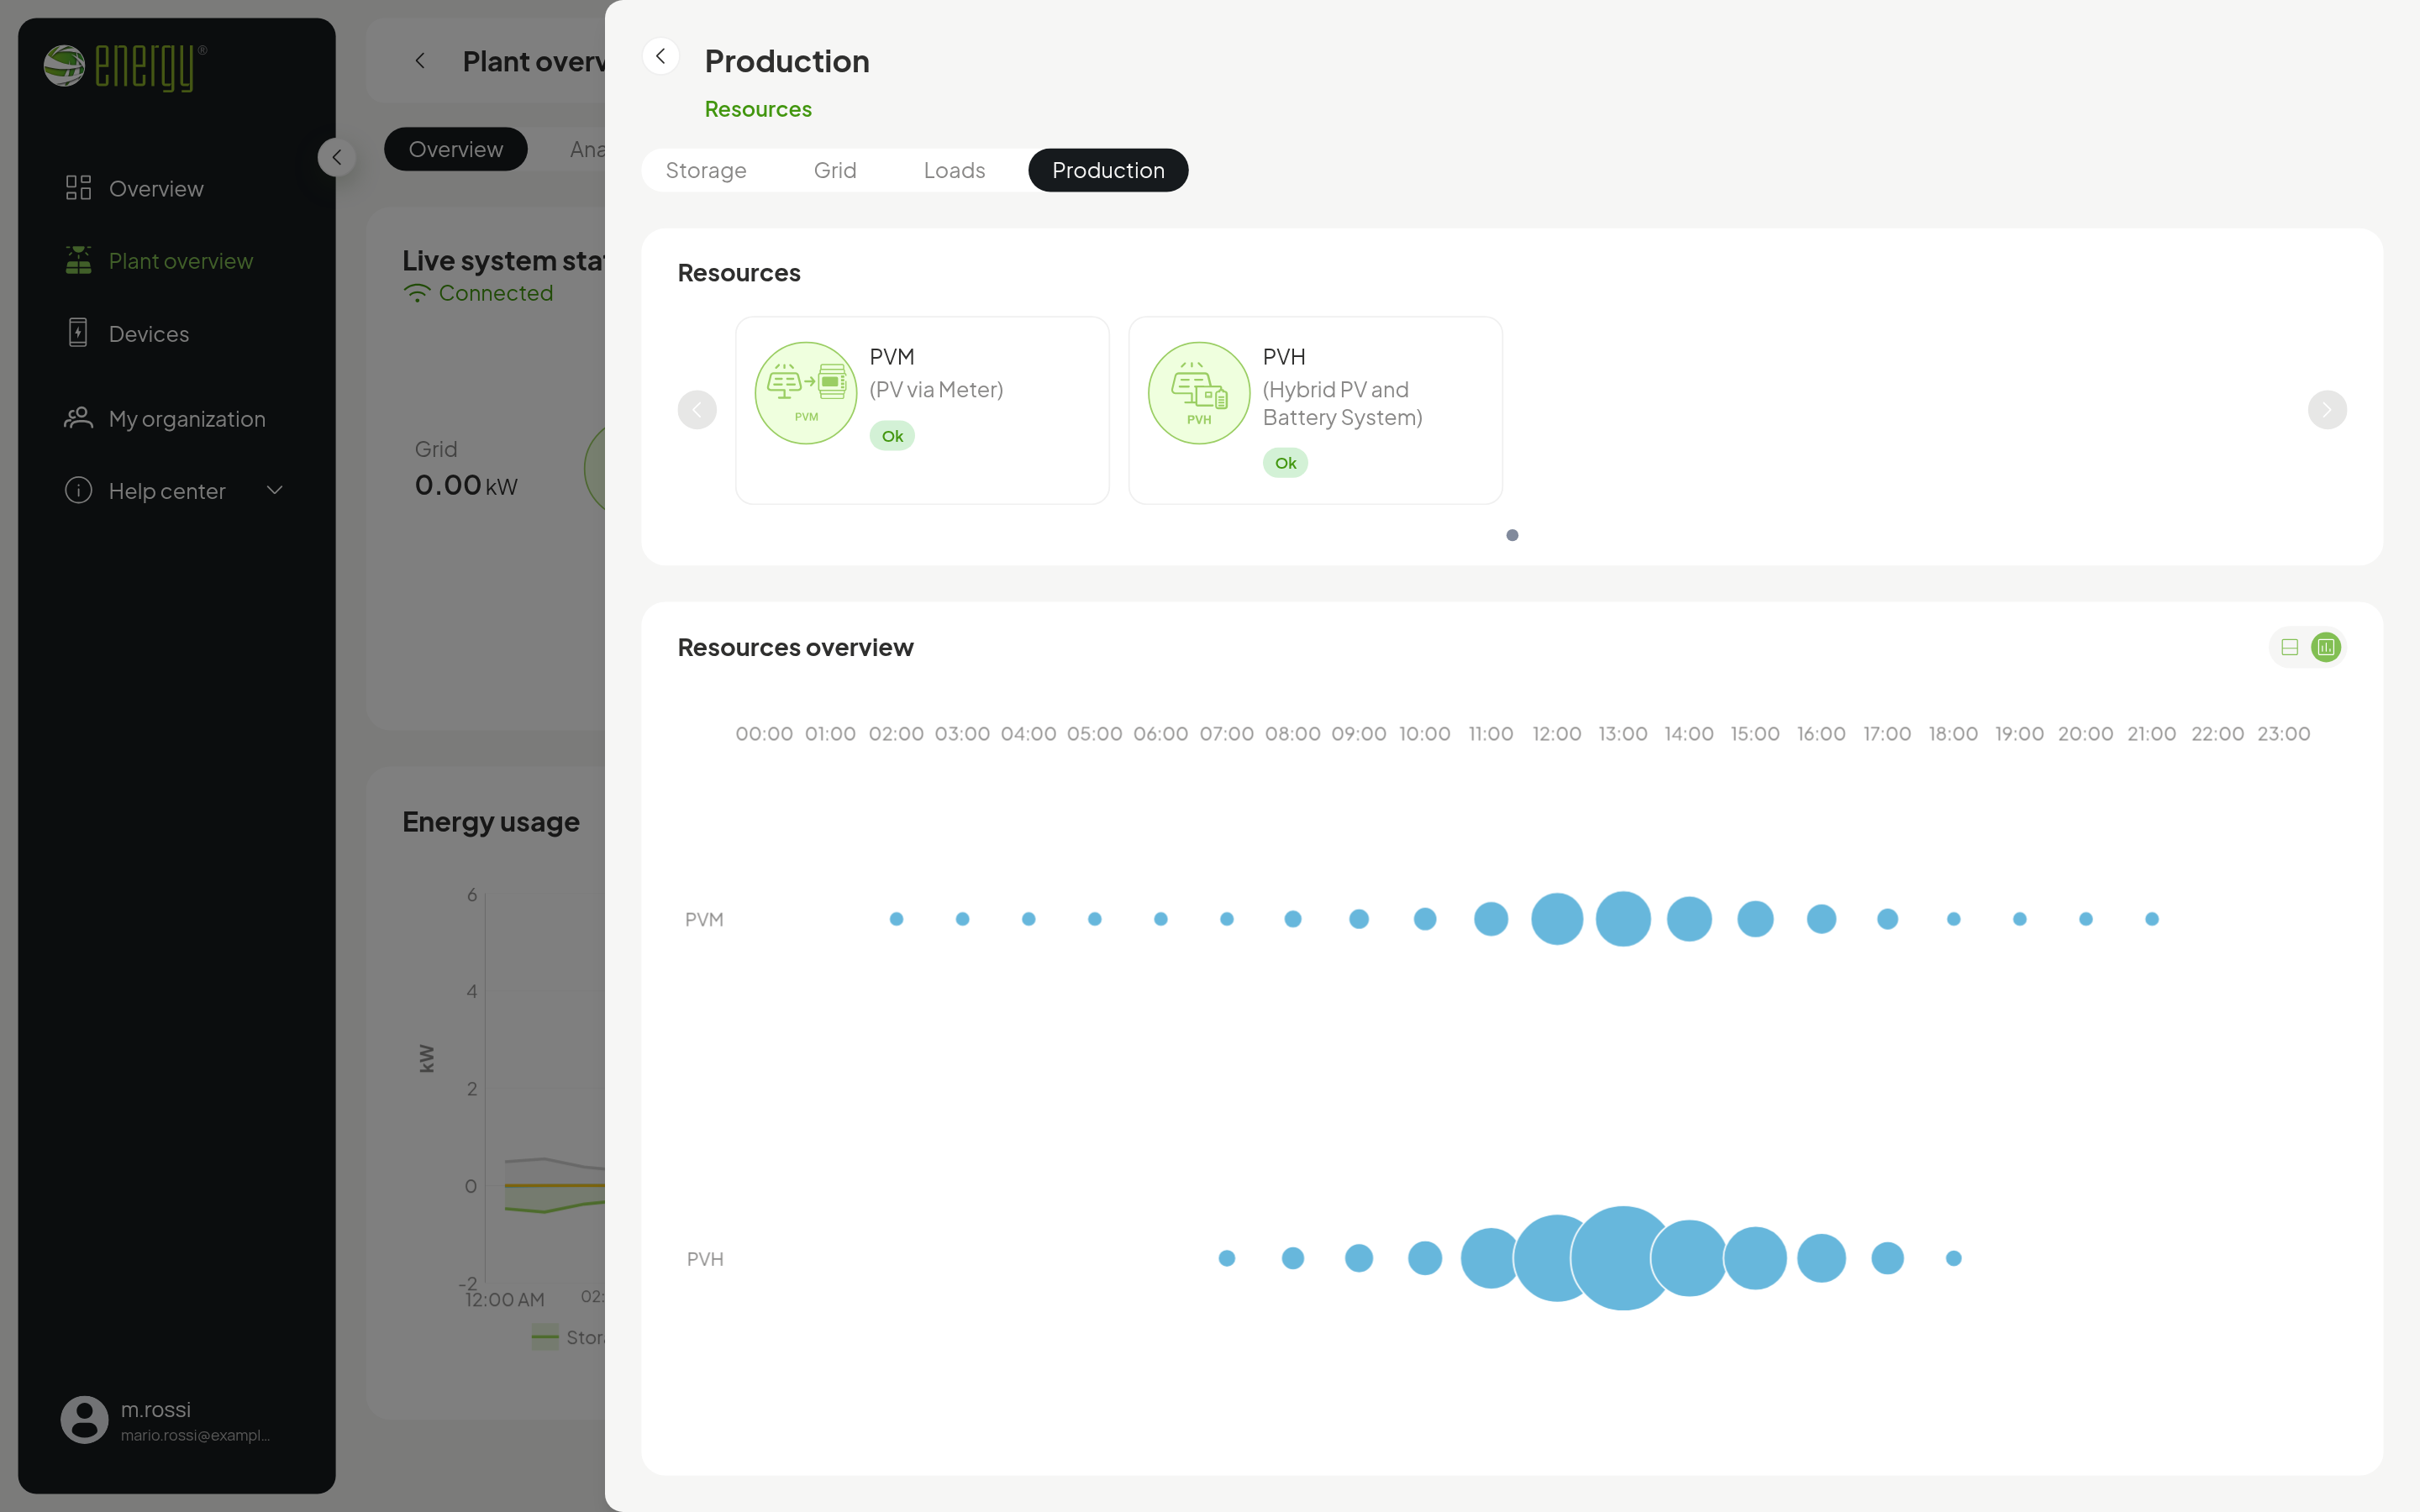
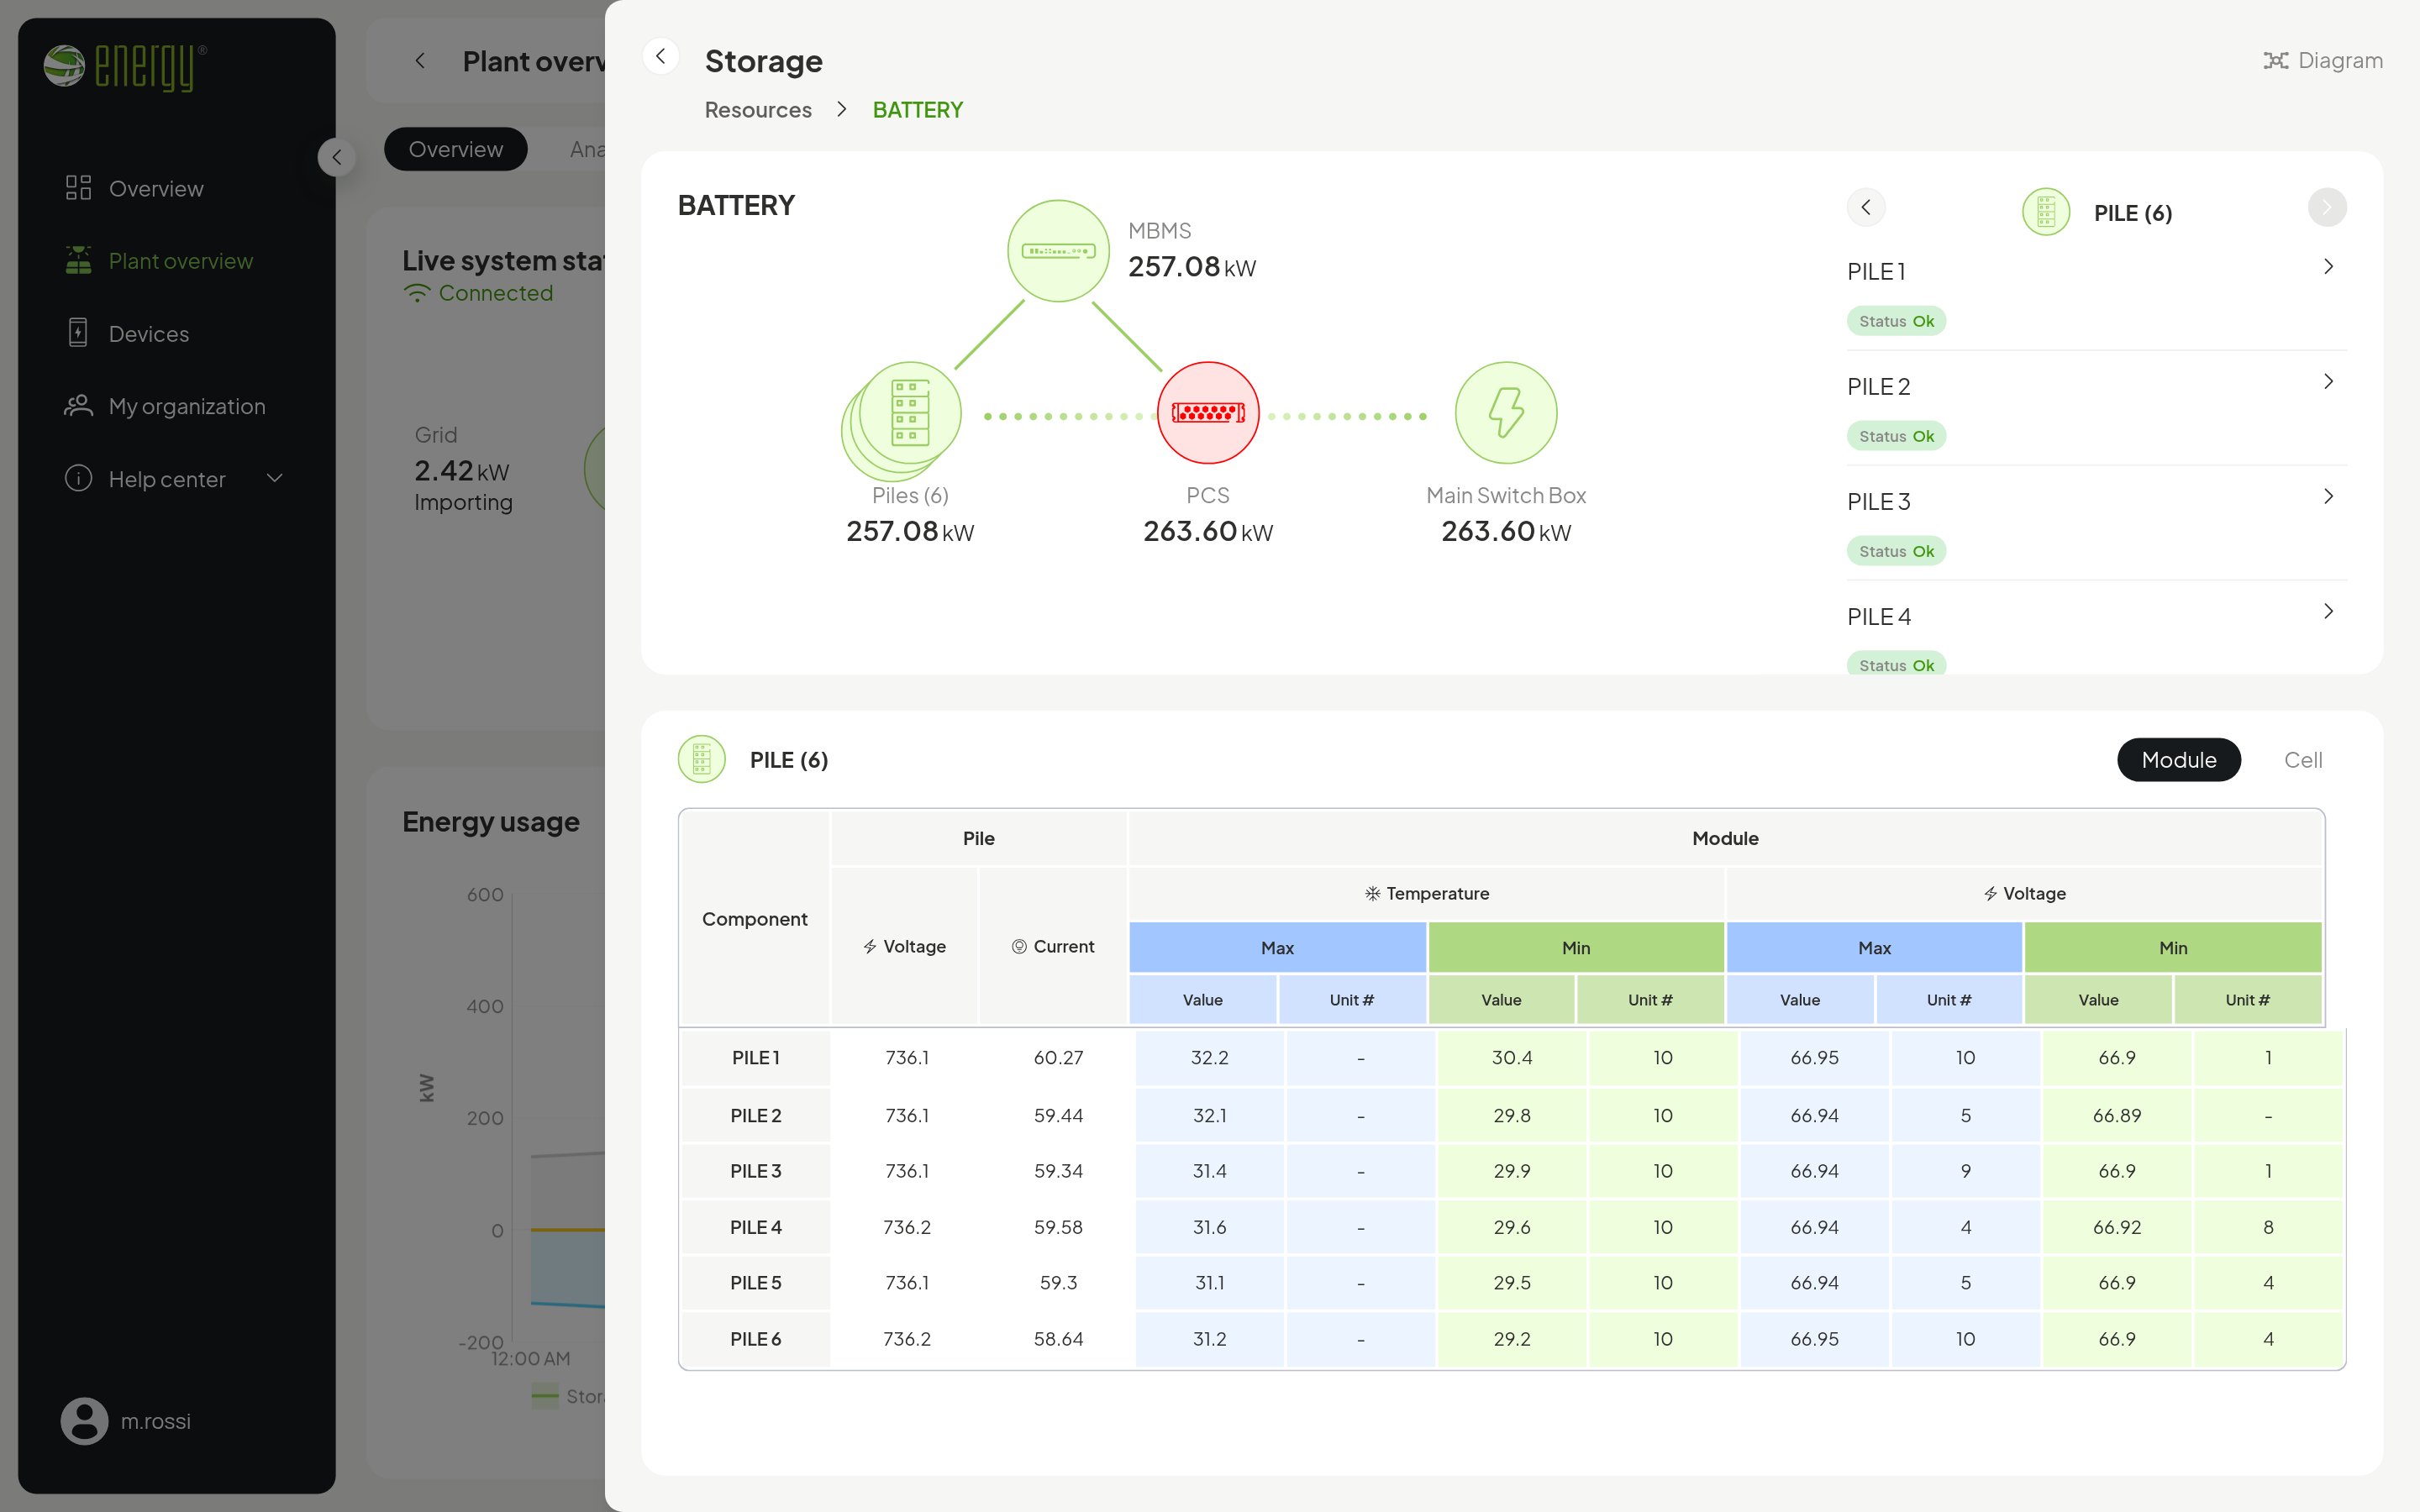
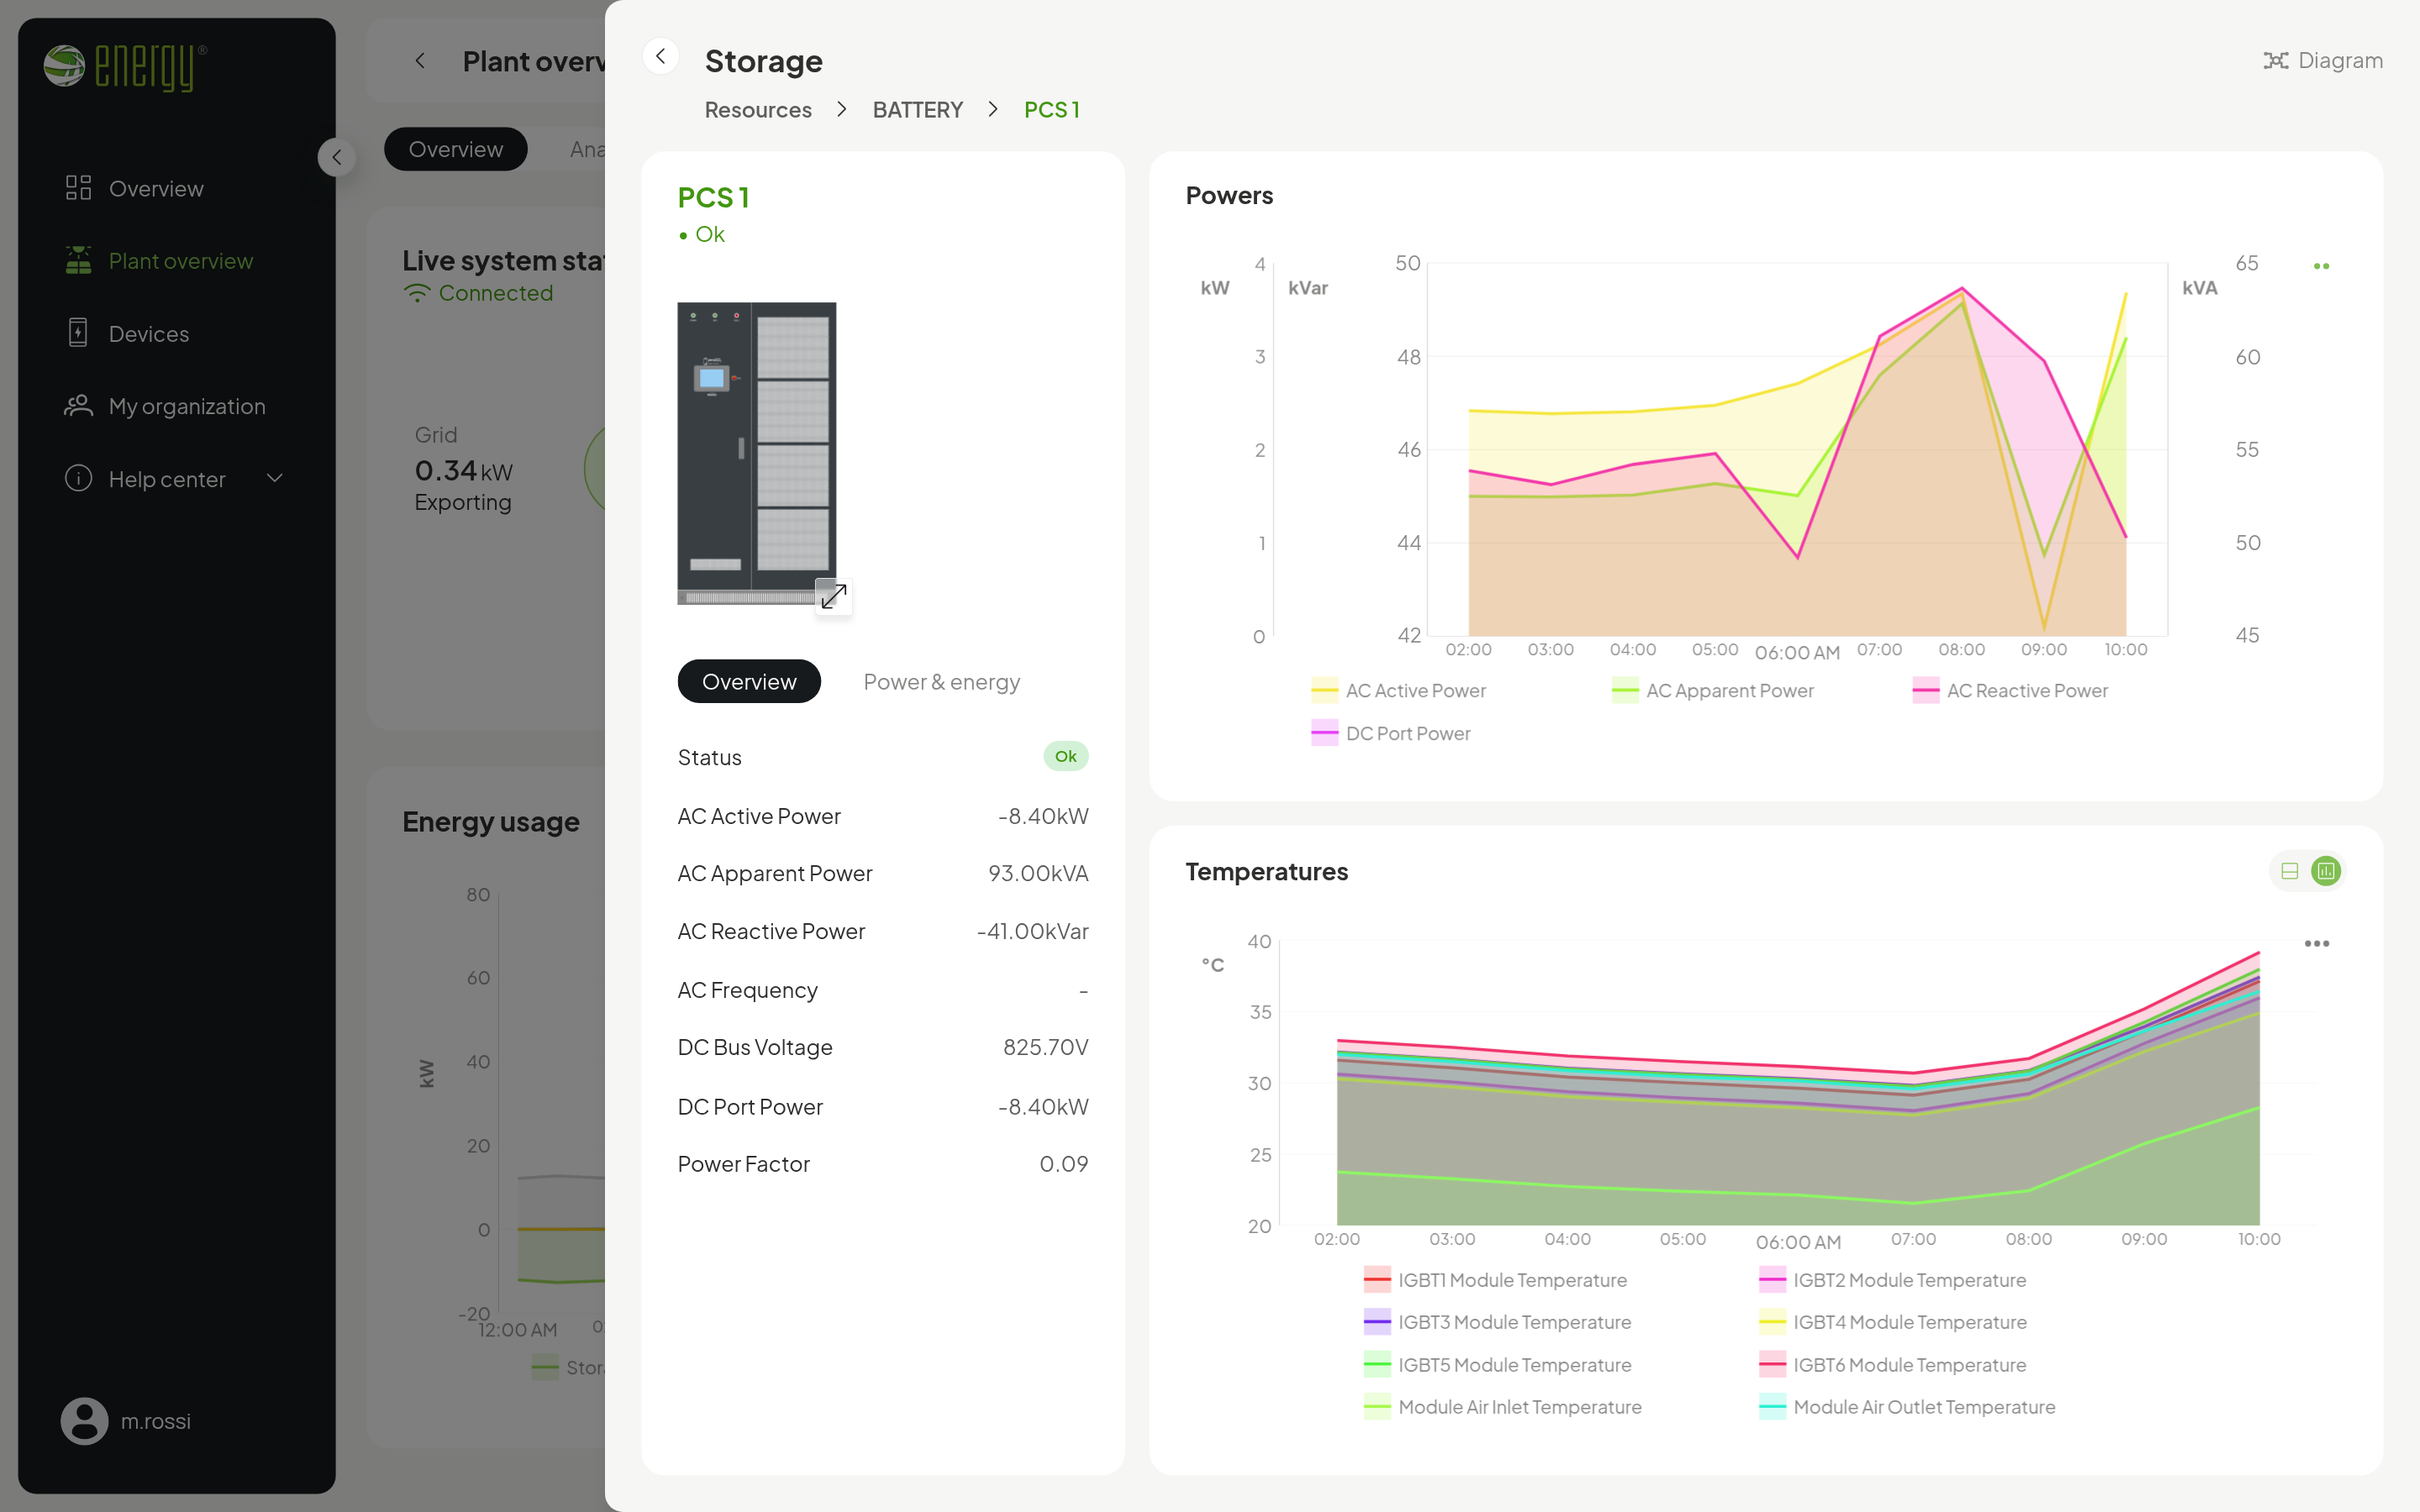
Production, grid, loads and storage with their flows, updated from the field. From the diagram you go down into the categories, the resources and down to the single component, and alarms show up where they arise.
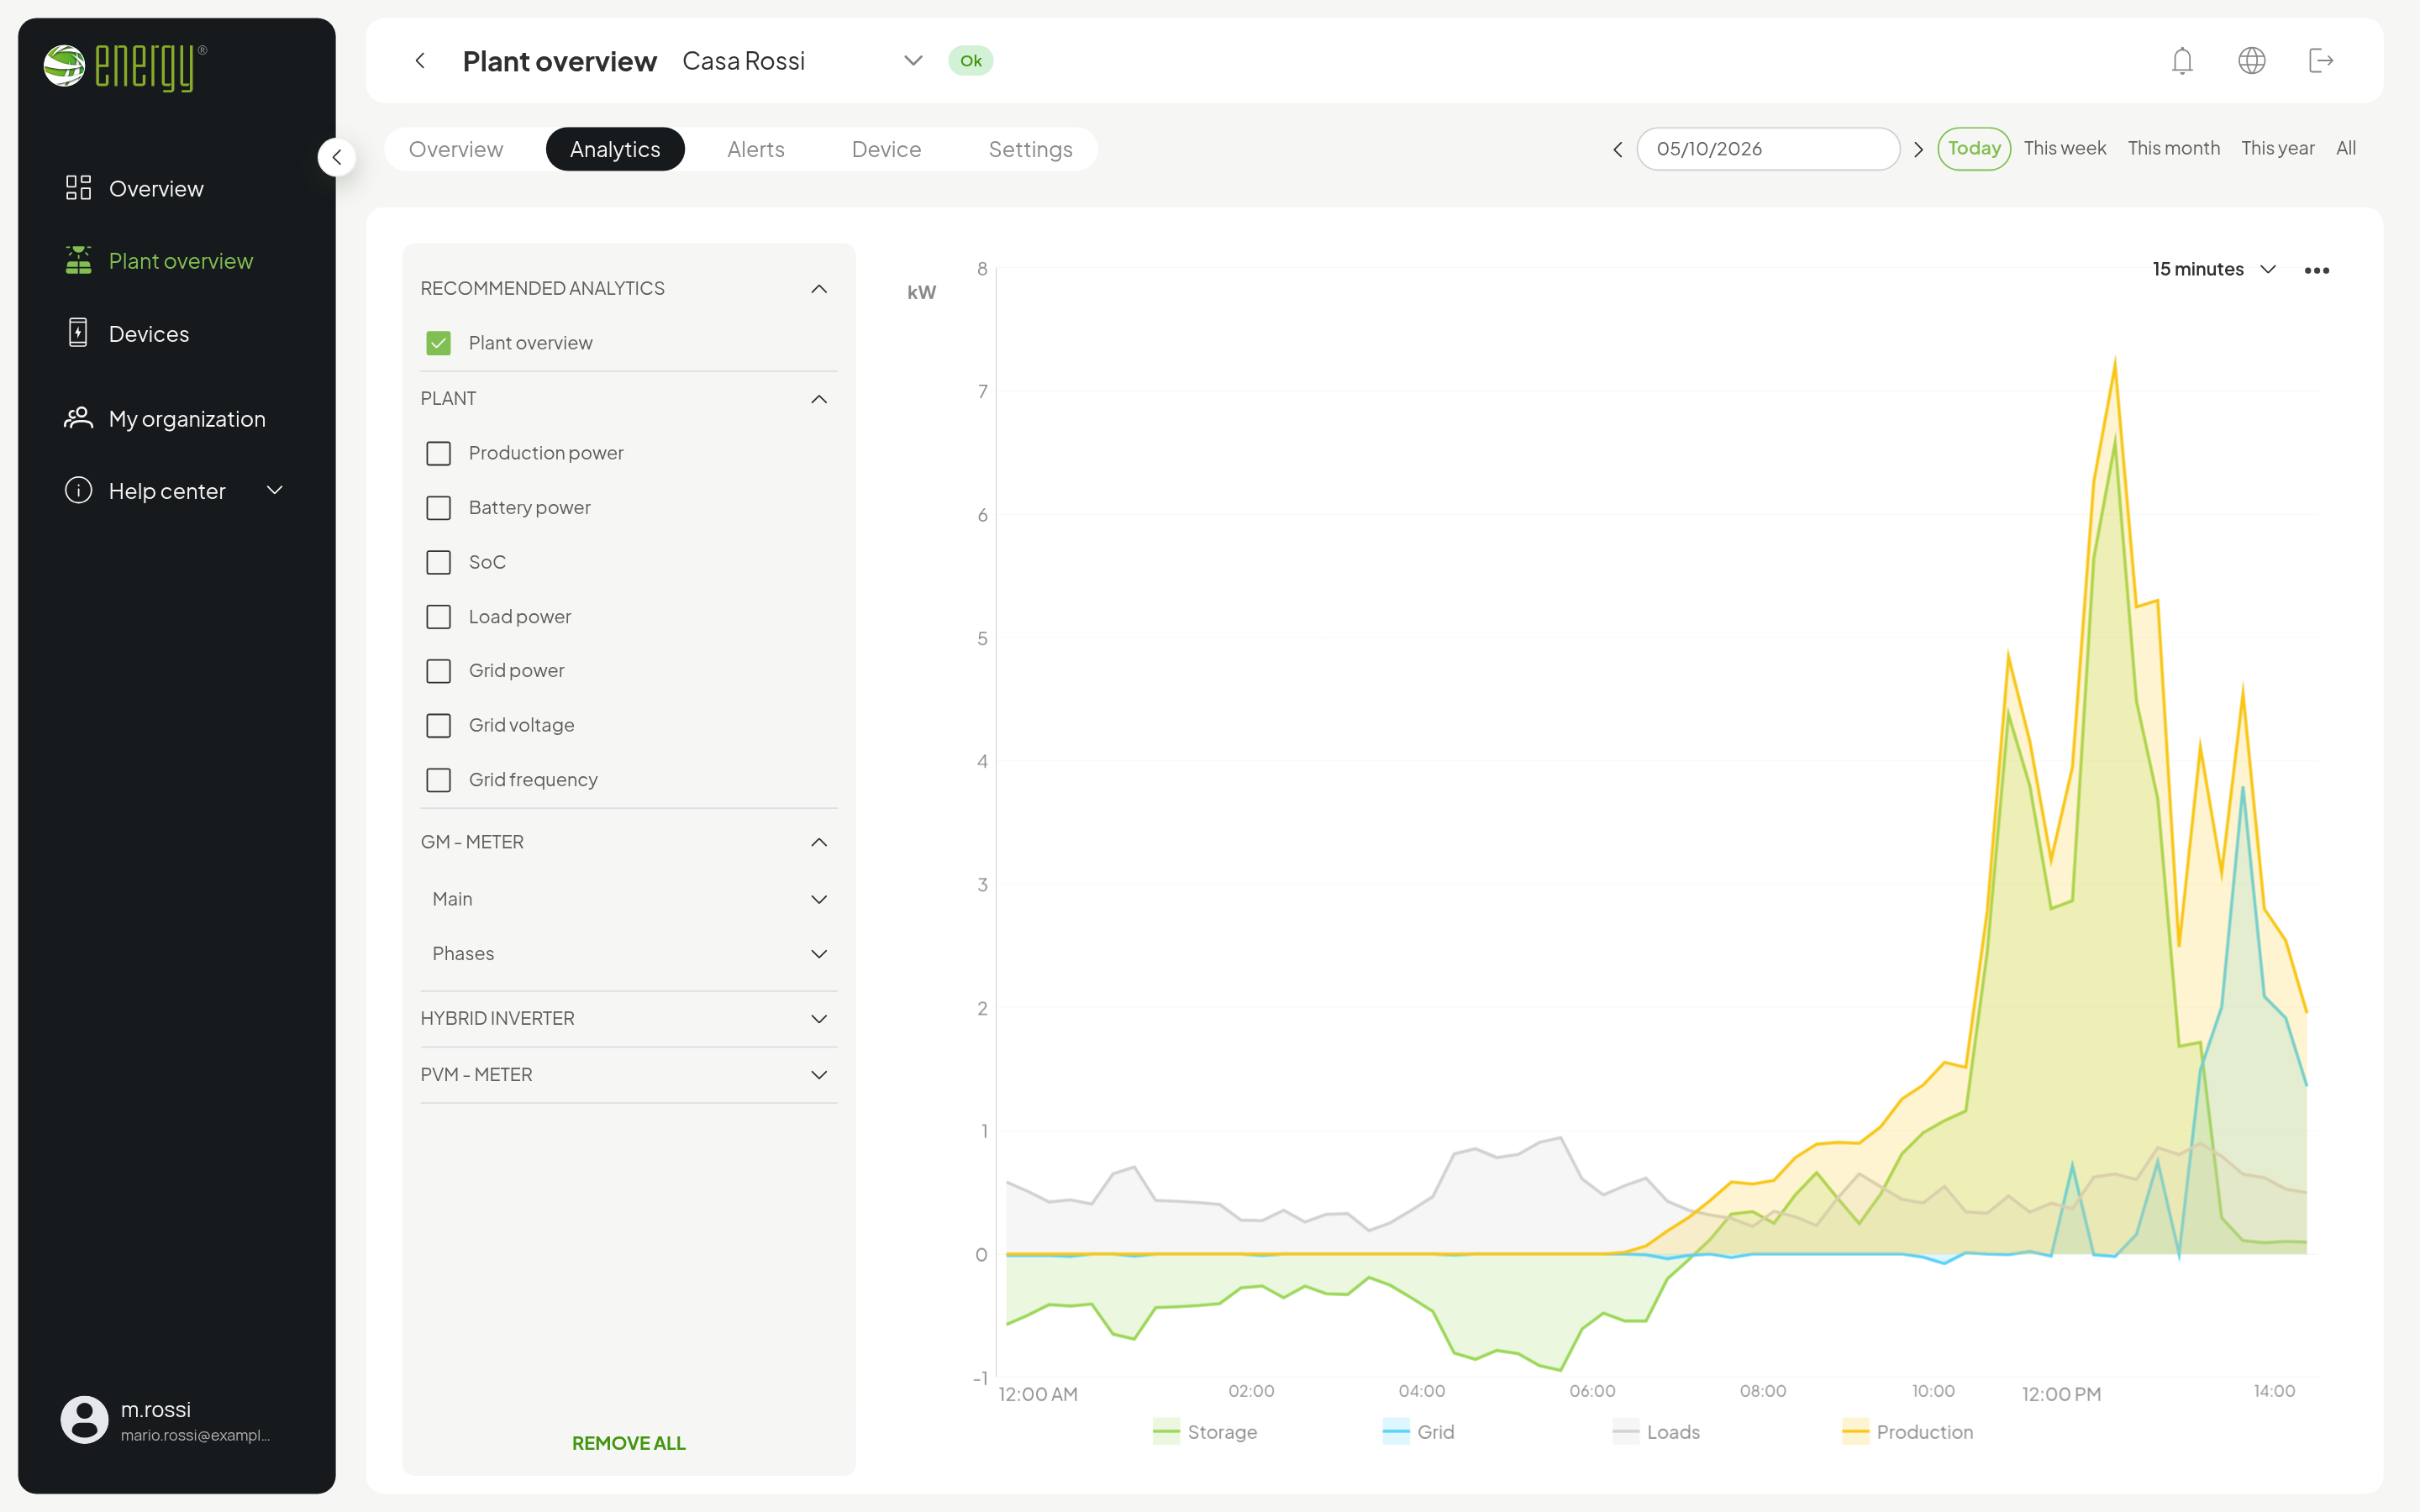
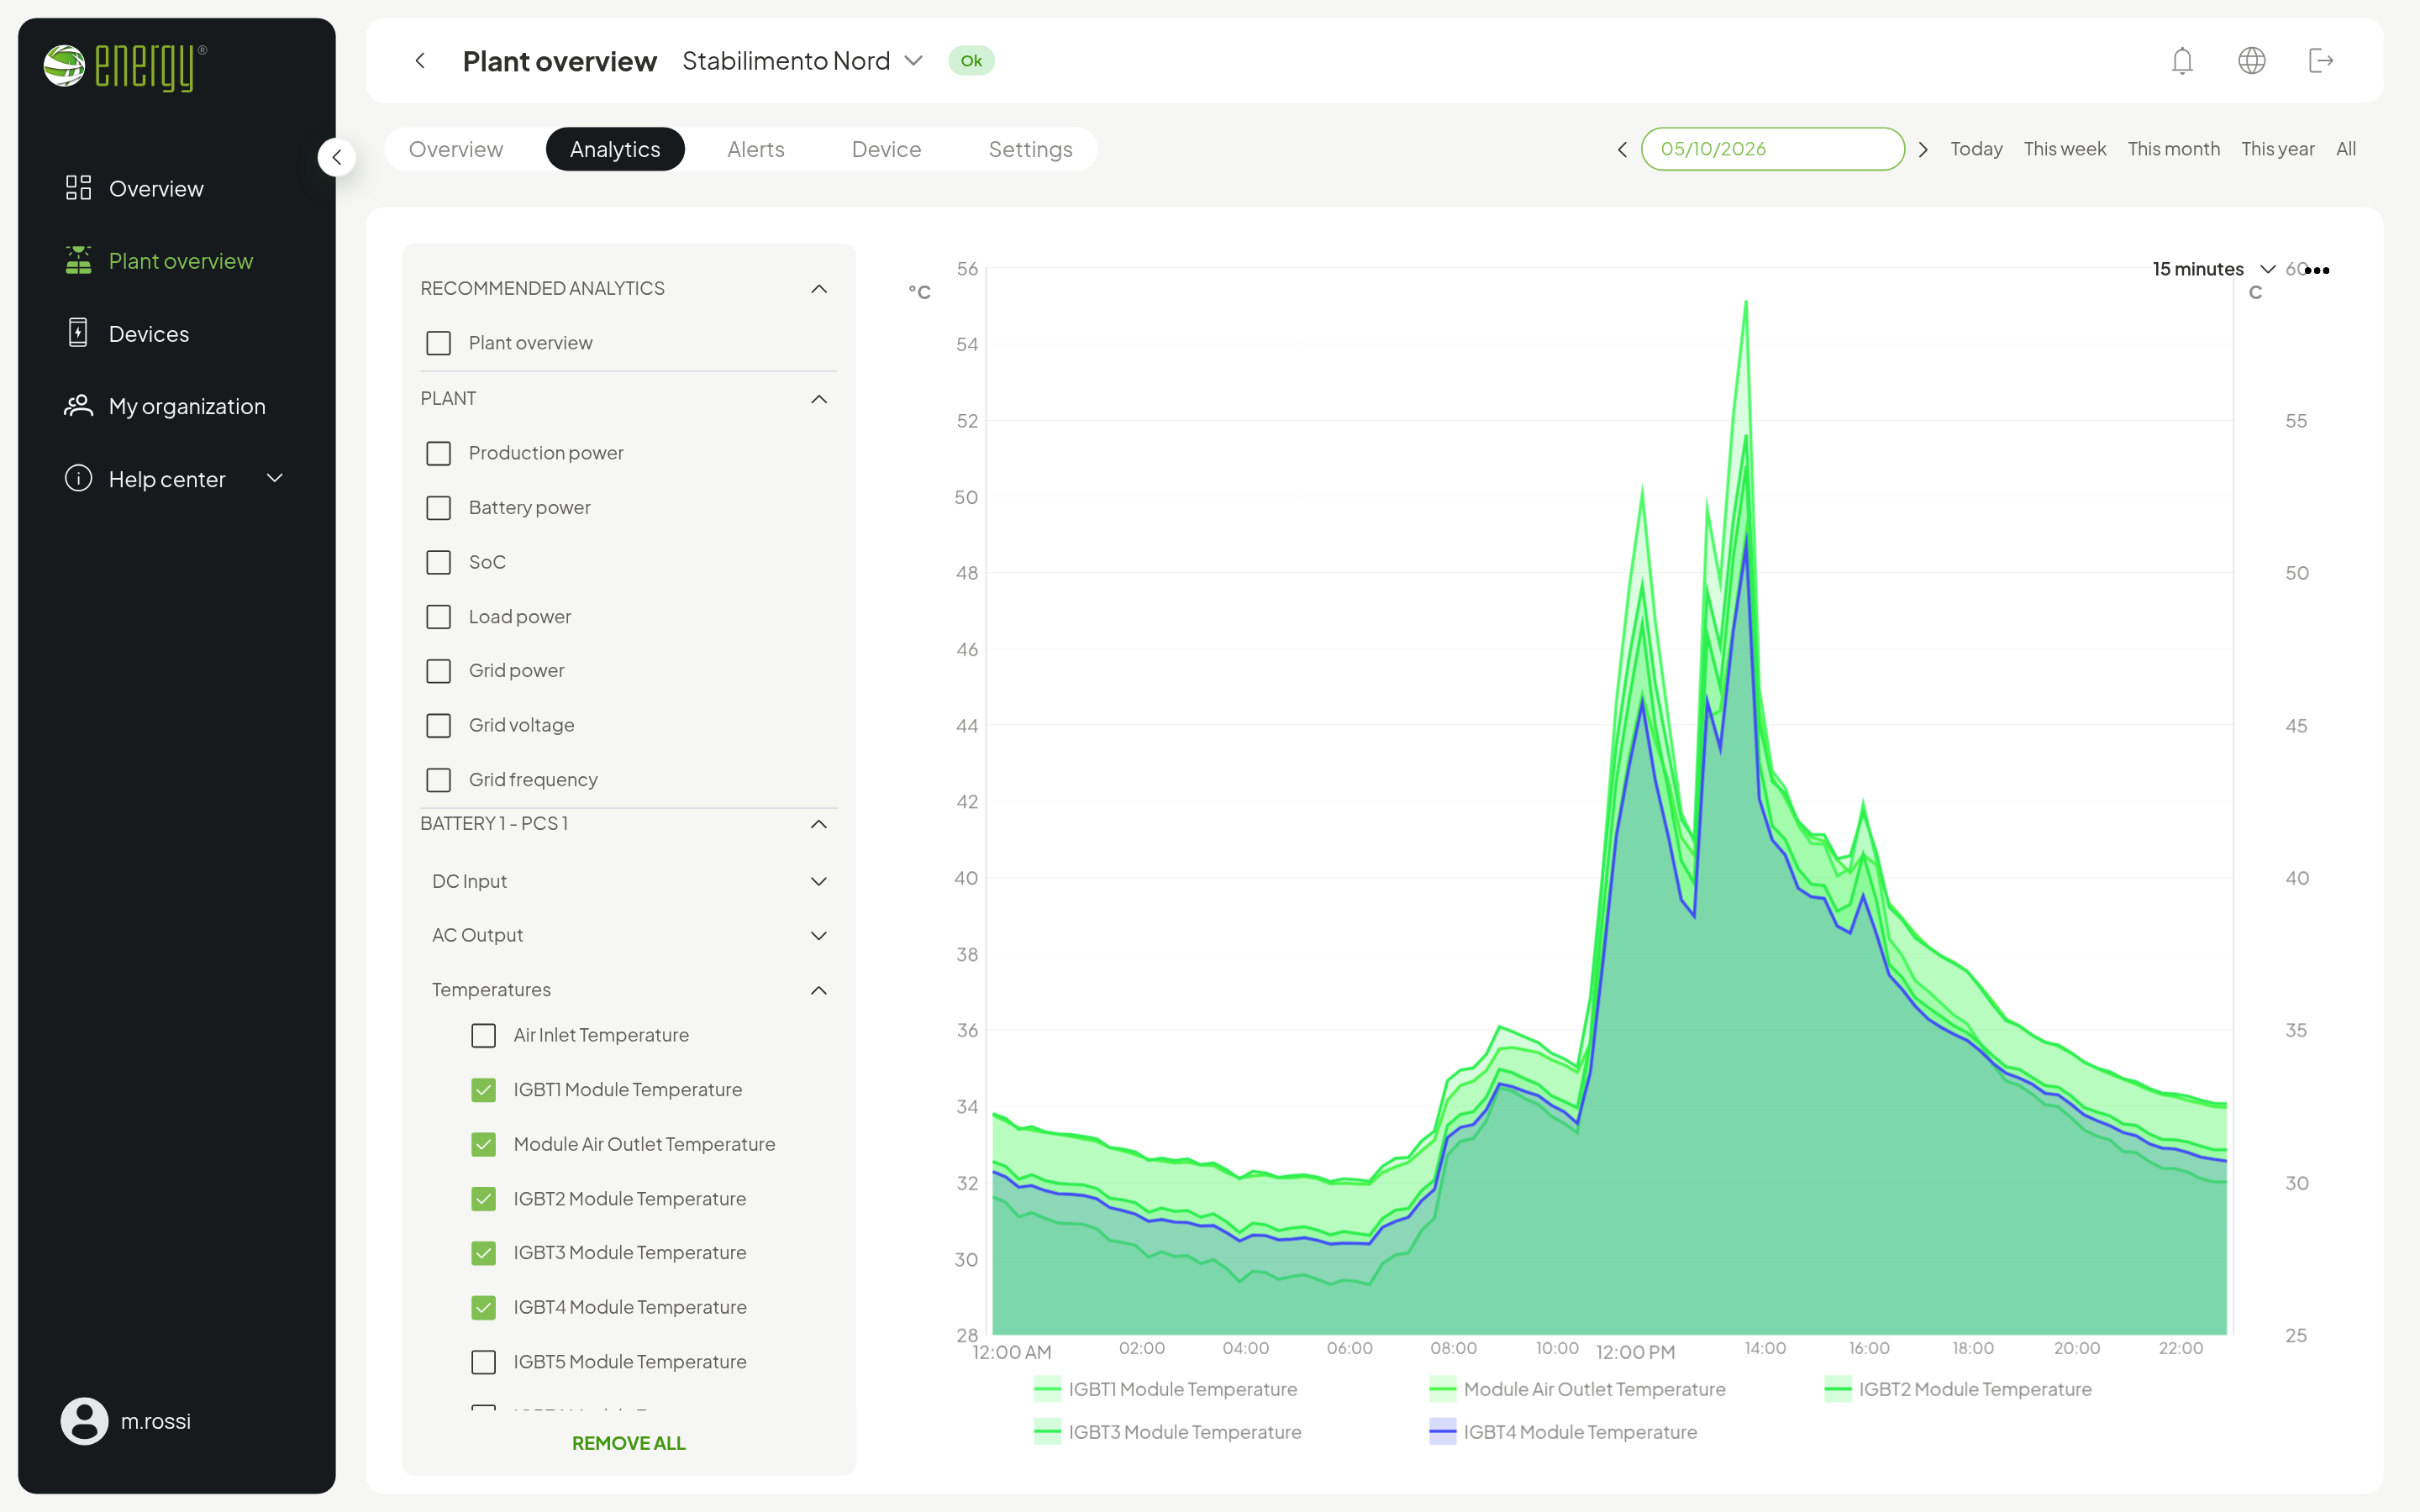
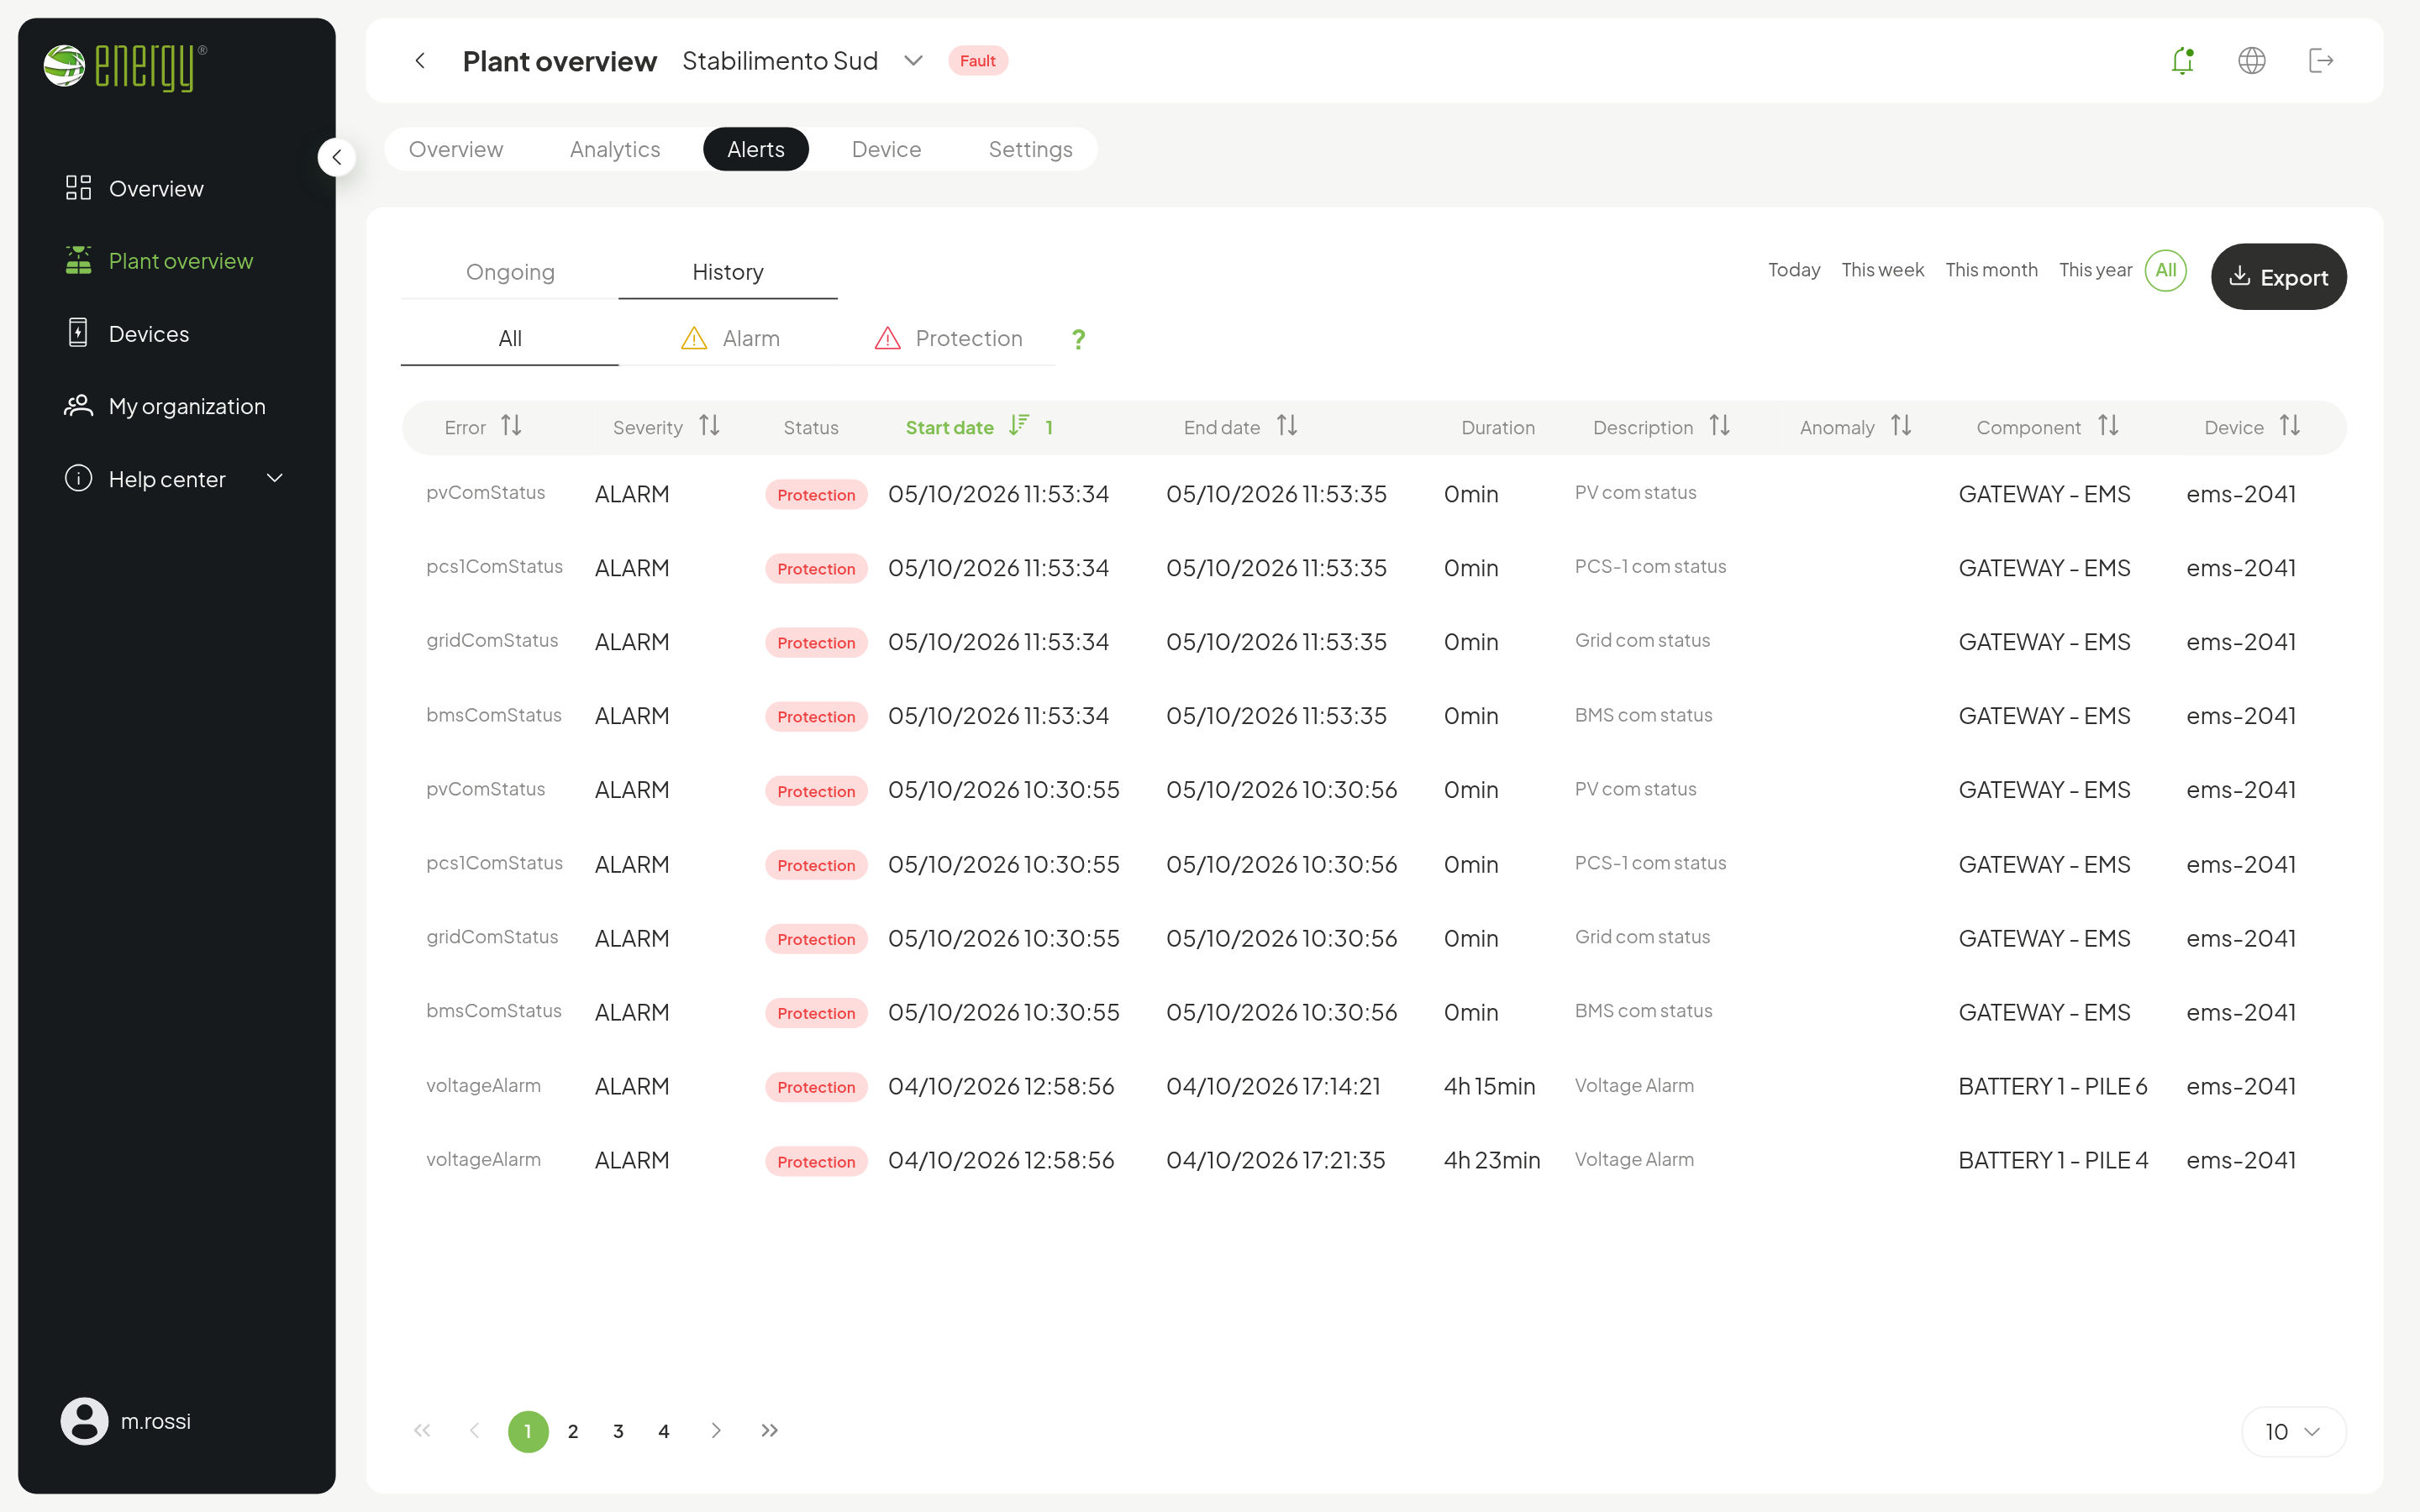
Detailed analysis.
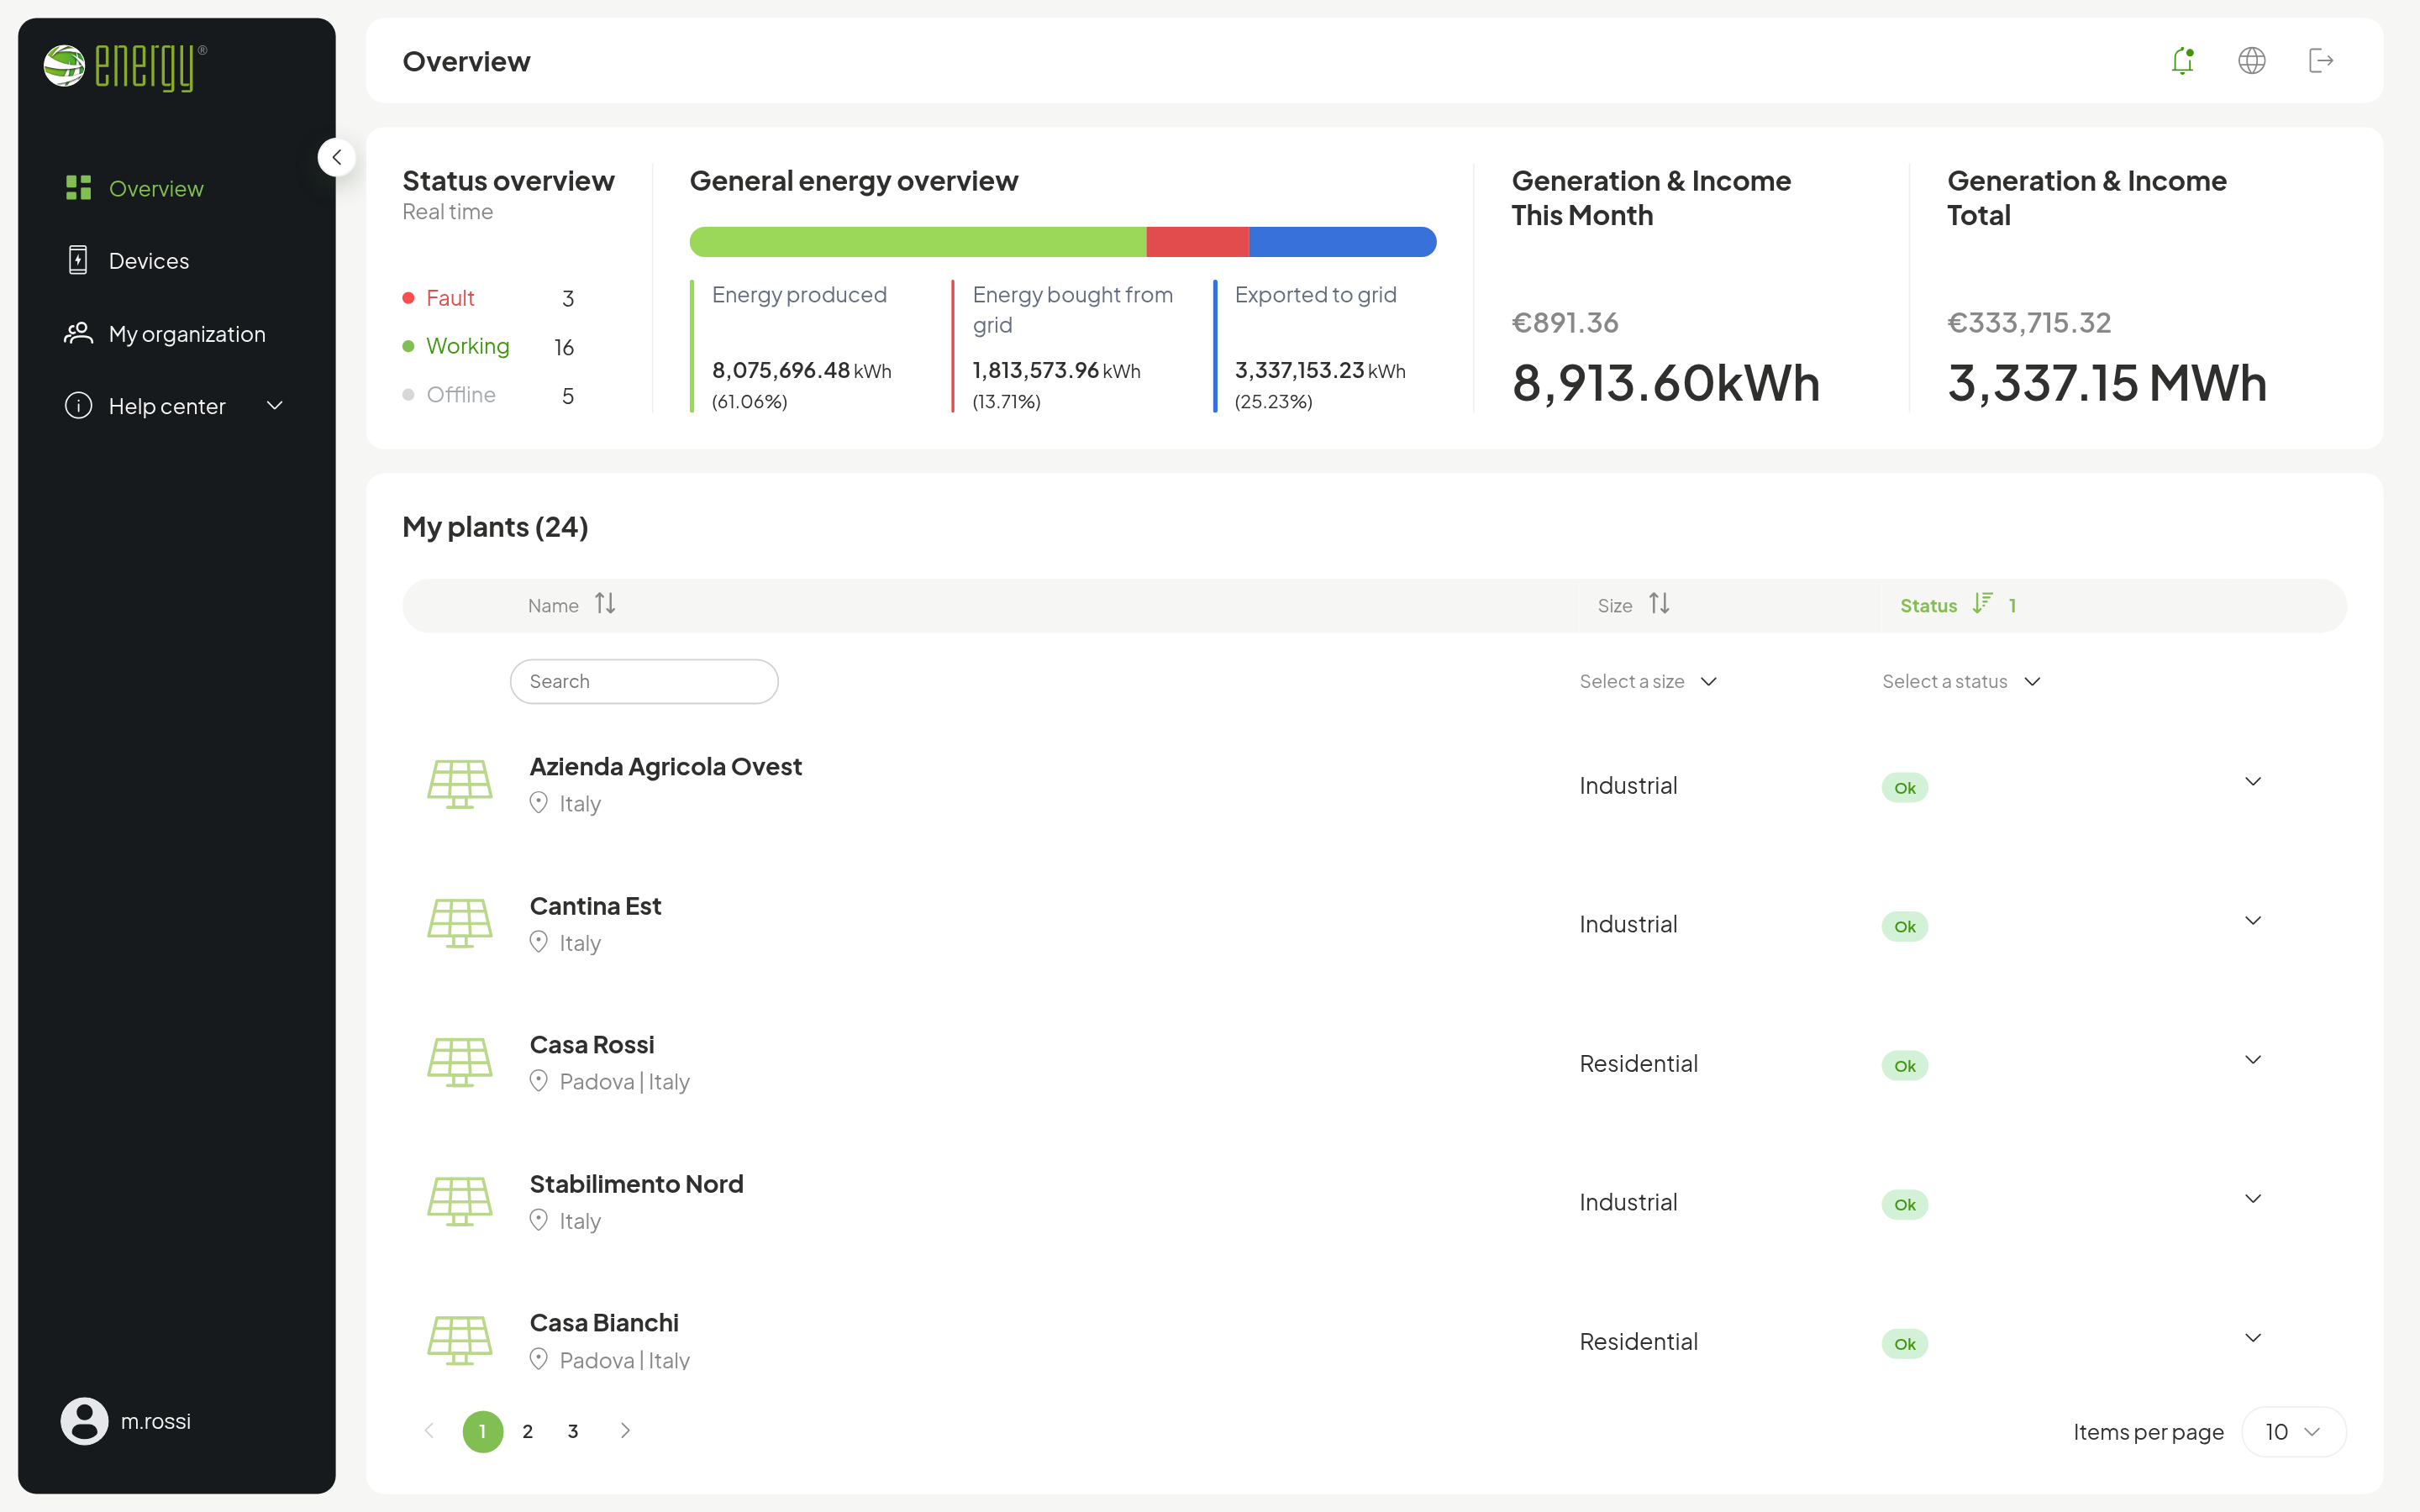
You build the charts: any quantity of any component, at the resolution you need, ready to export. Plus alarms with history and filters, and all plants at a glance.
The data, as it arrives from the field.
The portal does more than display: live readings, plant diagram and export, to work on the data with your own tools too.
Live data
One click on Live and the device readings reach the portal as they happen, to follow the plant in real time.
Plant diagram
On XL plants: grid, meter, inverters, switchboard and battery in their electrical position, with the power flowing through each.
Export
Charts as CSV, Excel, JSON or image and the alarm history as CSV, for the periods you choose.
Your plant, queried in natural language.
zeroCO2 connects to Claude and ChatGPT through MCP, the protocol AI assistants use to read external data. Sign in with your portal credentials and ask in your own words: the assistant answers with the data measured by your plant.
Why didn't the battery fully charge yesterday?
Yesterday the plant produced 9.8 kWh, against an average of 17.6 kWh over the last seven days. The battery reached 64% at 14:30 and from 17:00 it powered the house; at 22:00 it was at 40%. No alarms in the period. With less production, a partial charge is normal.
A customer's question
Check the installation of the Rossi plant.
Result: not passed. Registry and connection are fine: the device is online and sending data regularly. Two checks fail: there is an active alarm and, in the commissioning log, the battery test was not run. The other tests passed.
An installer's question, at the end of the job
How are my zeroCO2 XL plants doing?
Of the 24 XL plants you installed, 22 are connected with no open alarms. To look at first: Logistica Sud has sent no data since yesterday at 18:40; Stabilimento Est is connected but has 2 open alarms. This is a snapshot of connection and alarms: for production and yield, ask about the single plant.
An installer's question
How is the battery working? Is there anything to keep an eye on?
Over the last month the battery did 26 cycles, with an average depth of discharge of 74%. Temperatures between 18 and 29 °C, maximum difference between cells 18 mV. Efficiency is 92%, within the norm, and the state of health reported by the battery is 98%. No indicator outside the reference.
A customer's question
One portal, three ways to use it.
At home
Your home plant under control: what it produces, what it consumes, how much it covers on its own, how the battery works.
At the company
The site with its diagram: inverters, meter and battery with their quantities, down to the single module.
With several plants
All plants in one list, with the status of each and the overall energy; one click opens the single plant.
zeroCO2 Hybrid Inverters
Residential. Hybrid inverter with storage, monitored unit by unit: production, battery, loads and grid of the house.
zeroCO2 XL
Commercial and industrial. Several PV inverters, pile storage with its inverters, meter and energy management system in one diagram.